Python notebooks that stay in sync.
Change a parameter and every value, plot and paragraph that depends on it updates.
Nothing else reruns, nothing goes stale. Notes, a grid of cells and a dependency graph over one
plain .workbook.py file.
pip install reaktiv-workbook then reaktiv-workbook new --from welcome
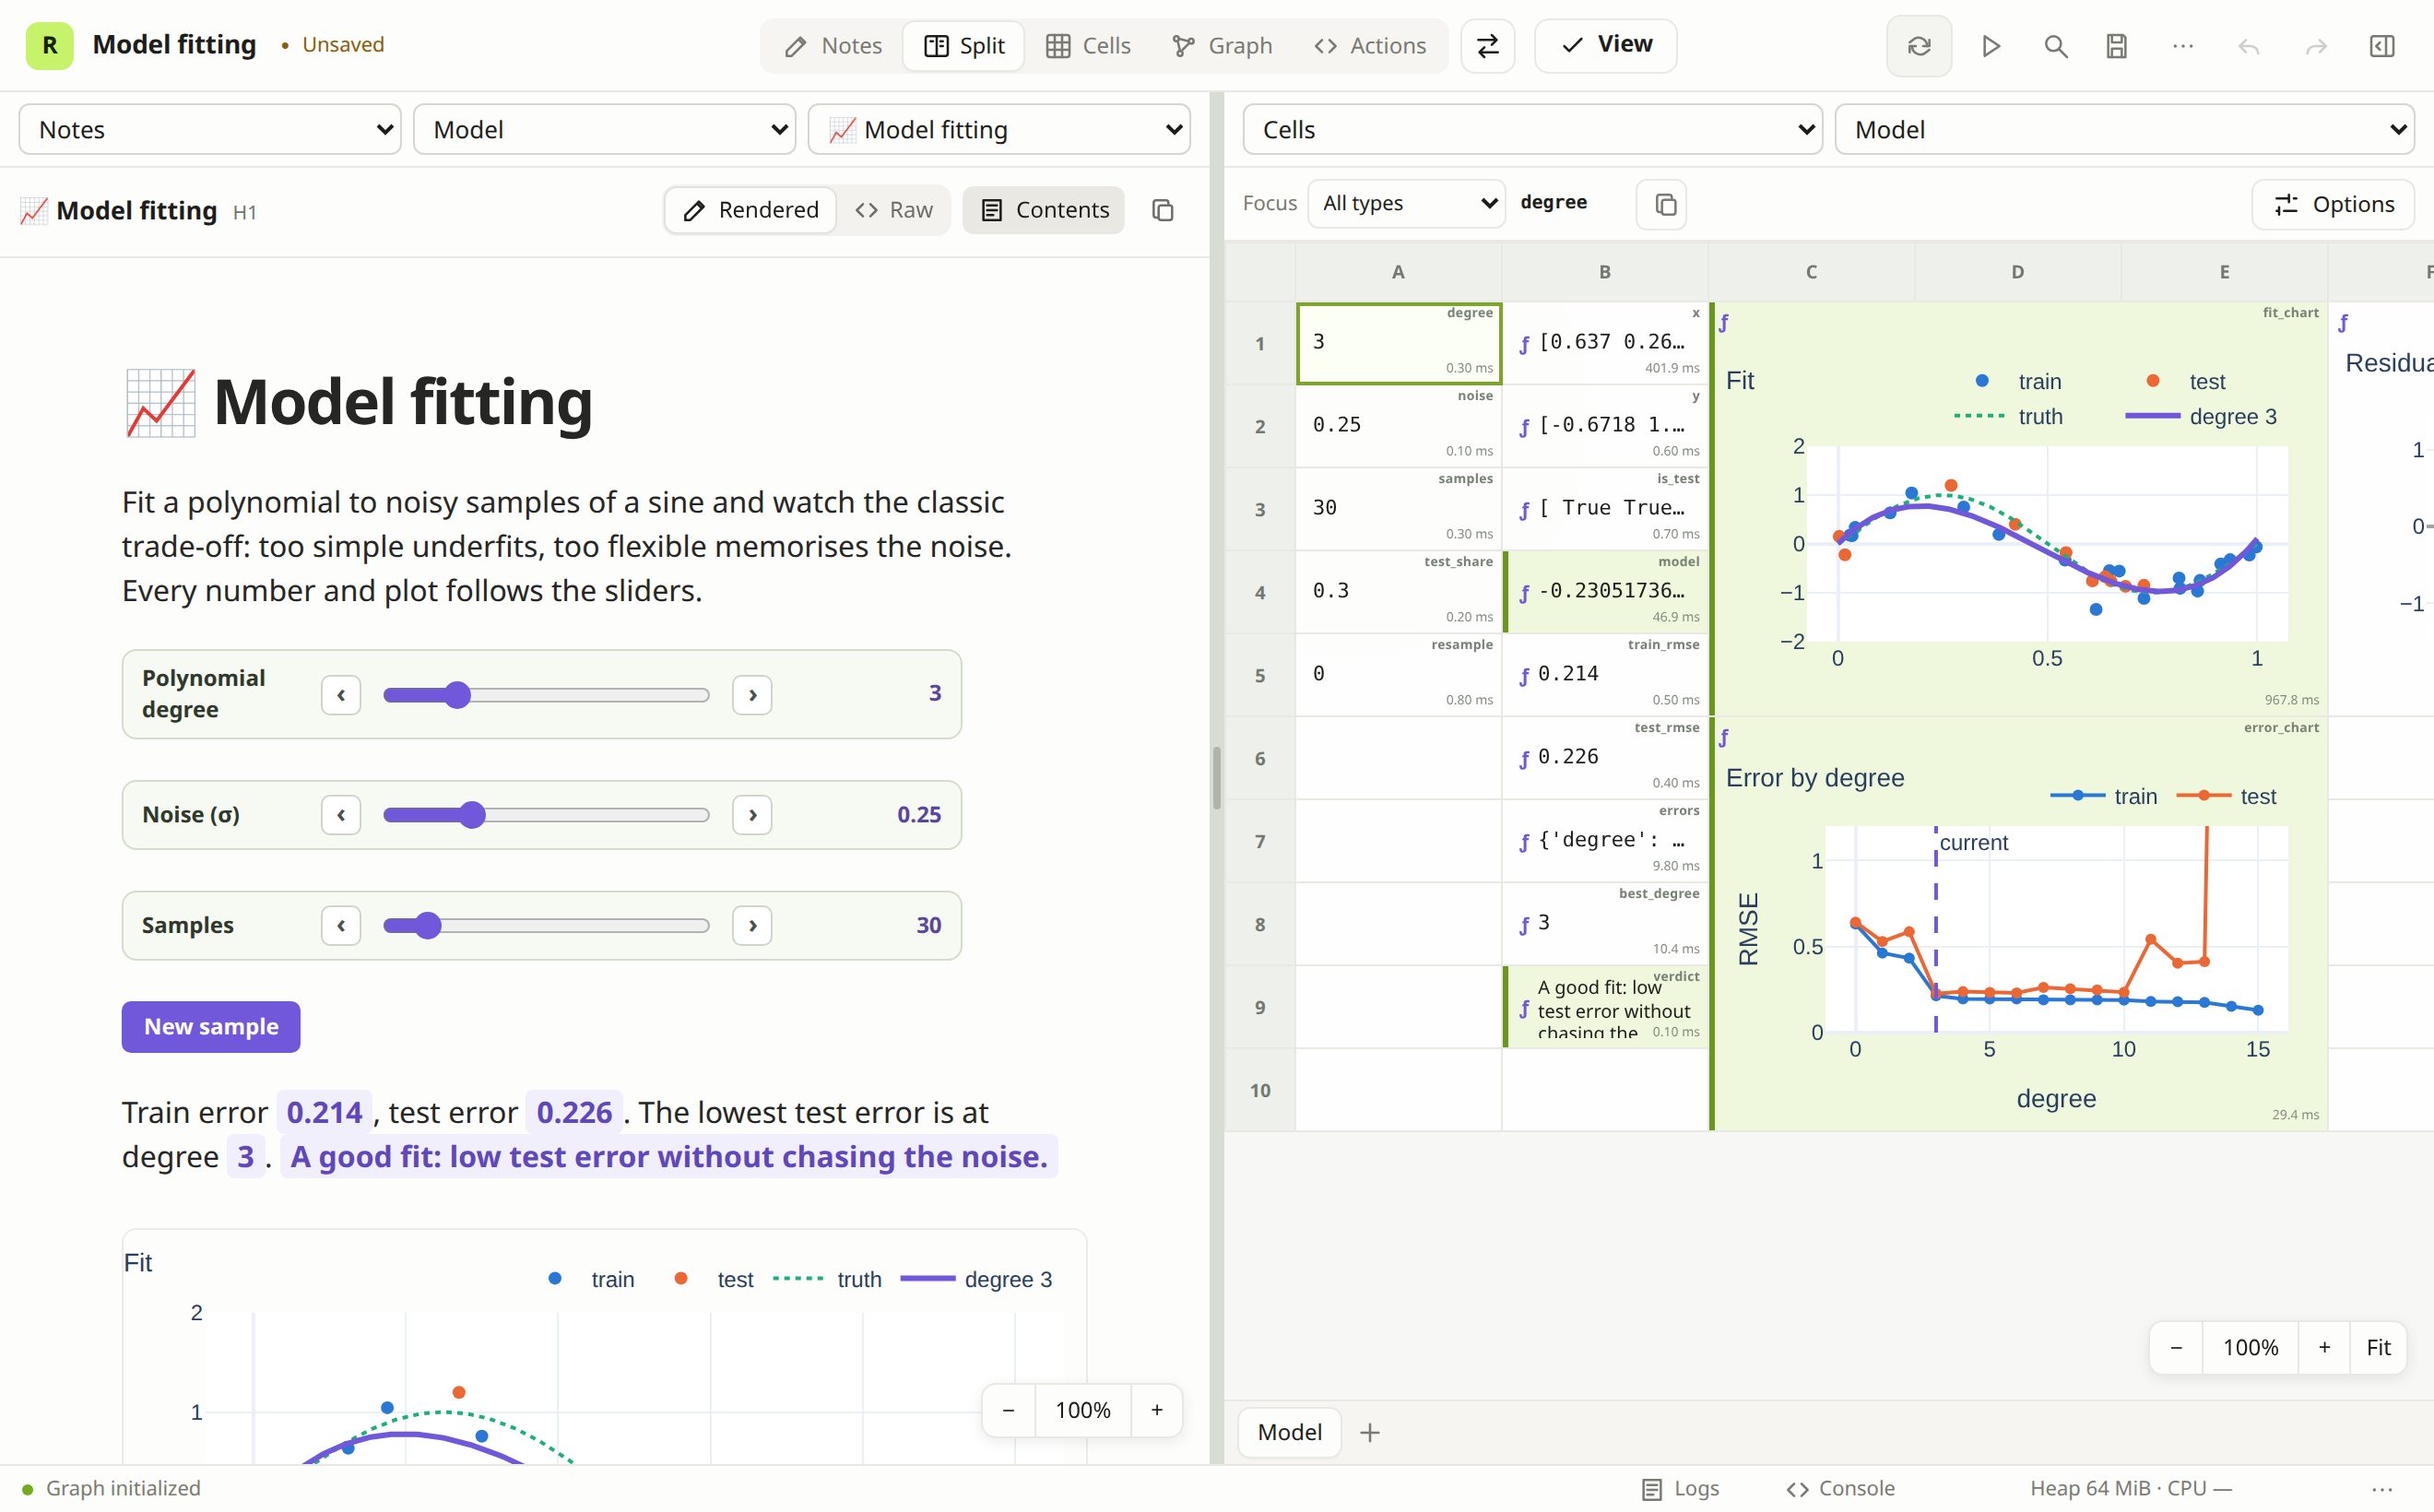
Works with your stack: NumPy, pandas, scikit-learn, Plotly, Matplotlib, anywidget, and anything you can pip install.
Explore faster, without the stale state.
No hidden state
Cells update like spreadsheet formulas: change an input and everything that reads it recomputes, in dependency order. No “run all”, no stale variables, no out-of-order surprises.
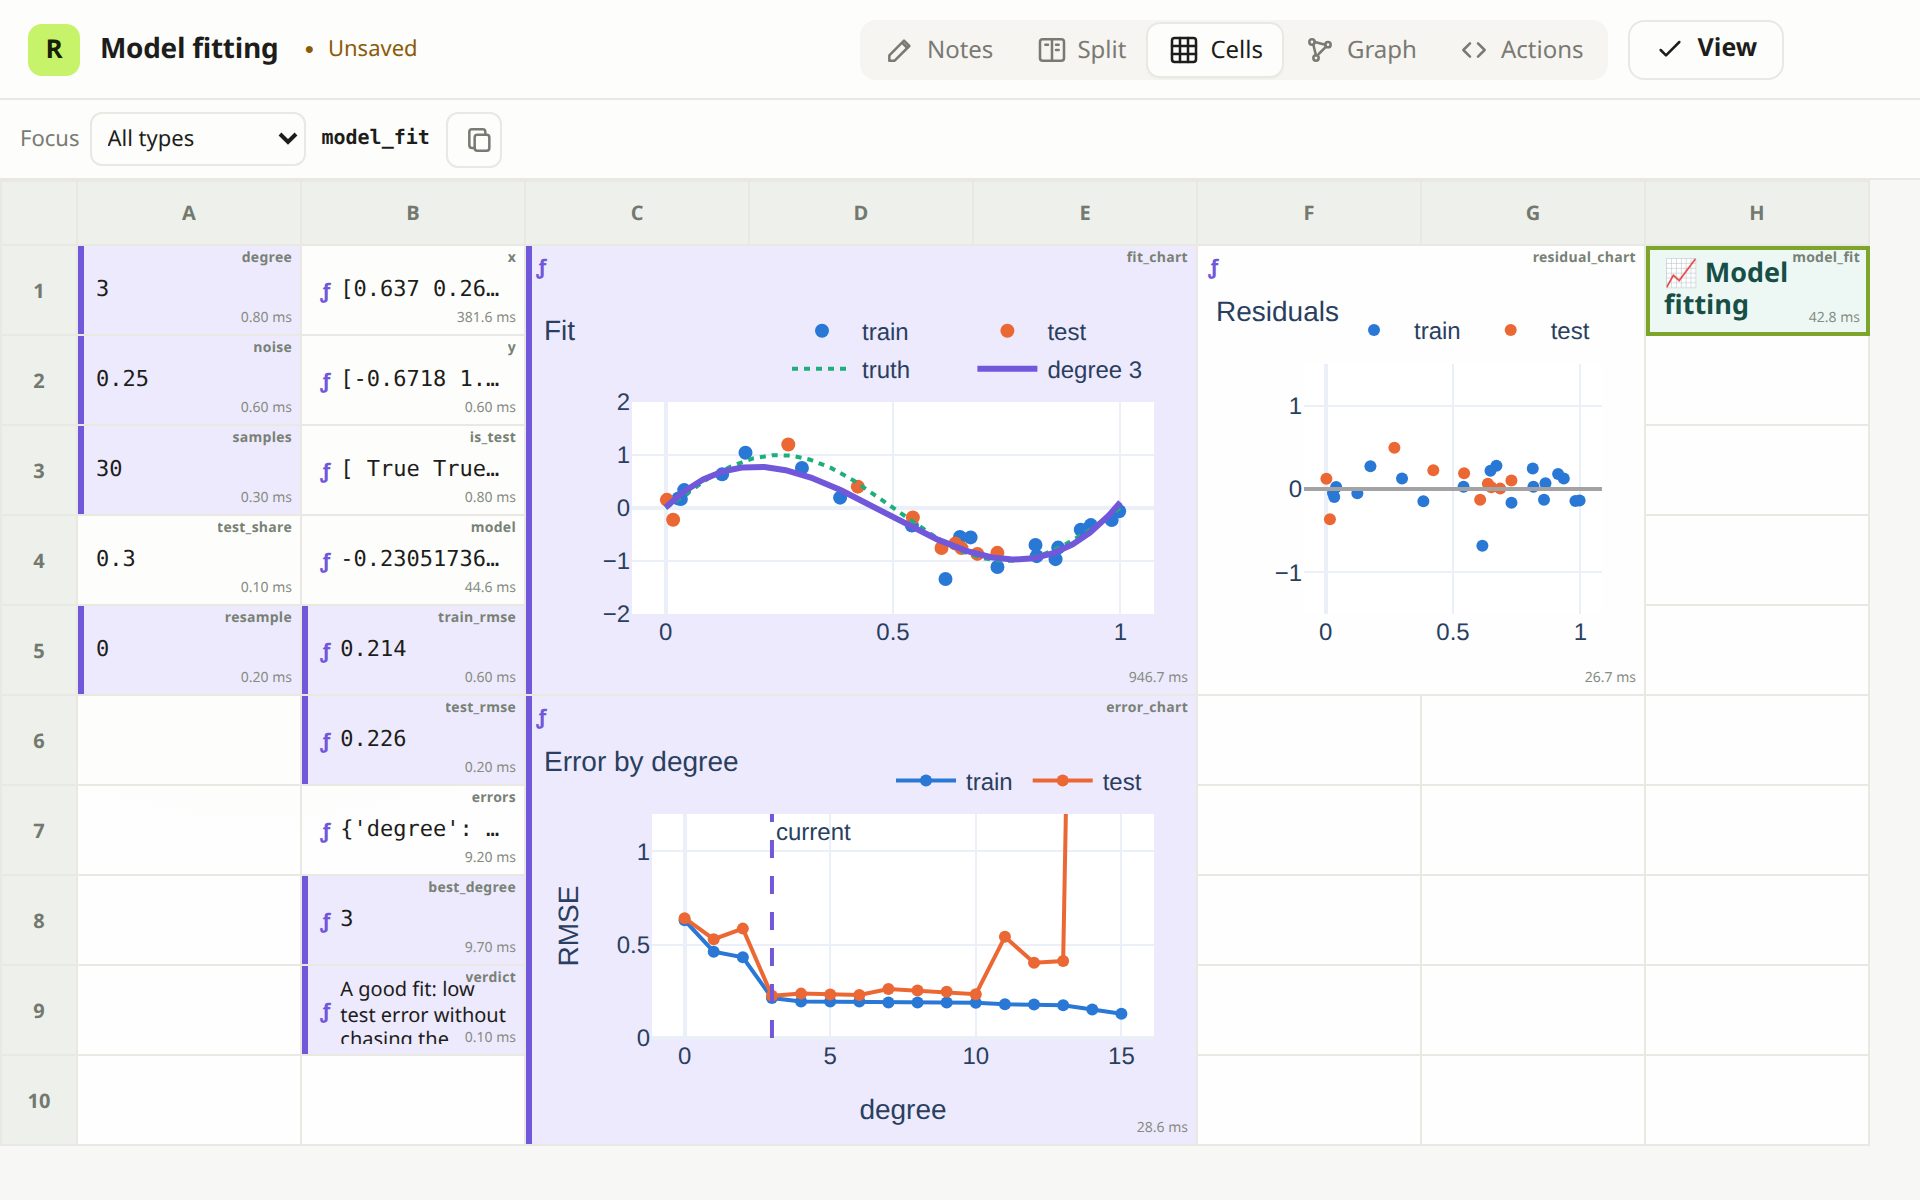
Everything on one screen
A spreadsheet-style grid puts inputs, intermediate results and plots side by side, so a whole analysis or dashboard fits on one screen instead of a long scroll.
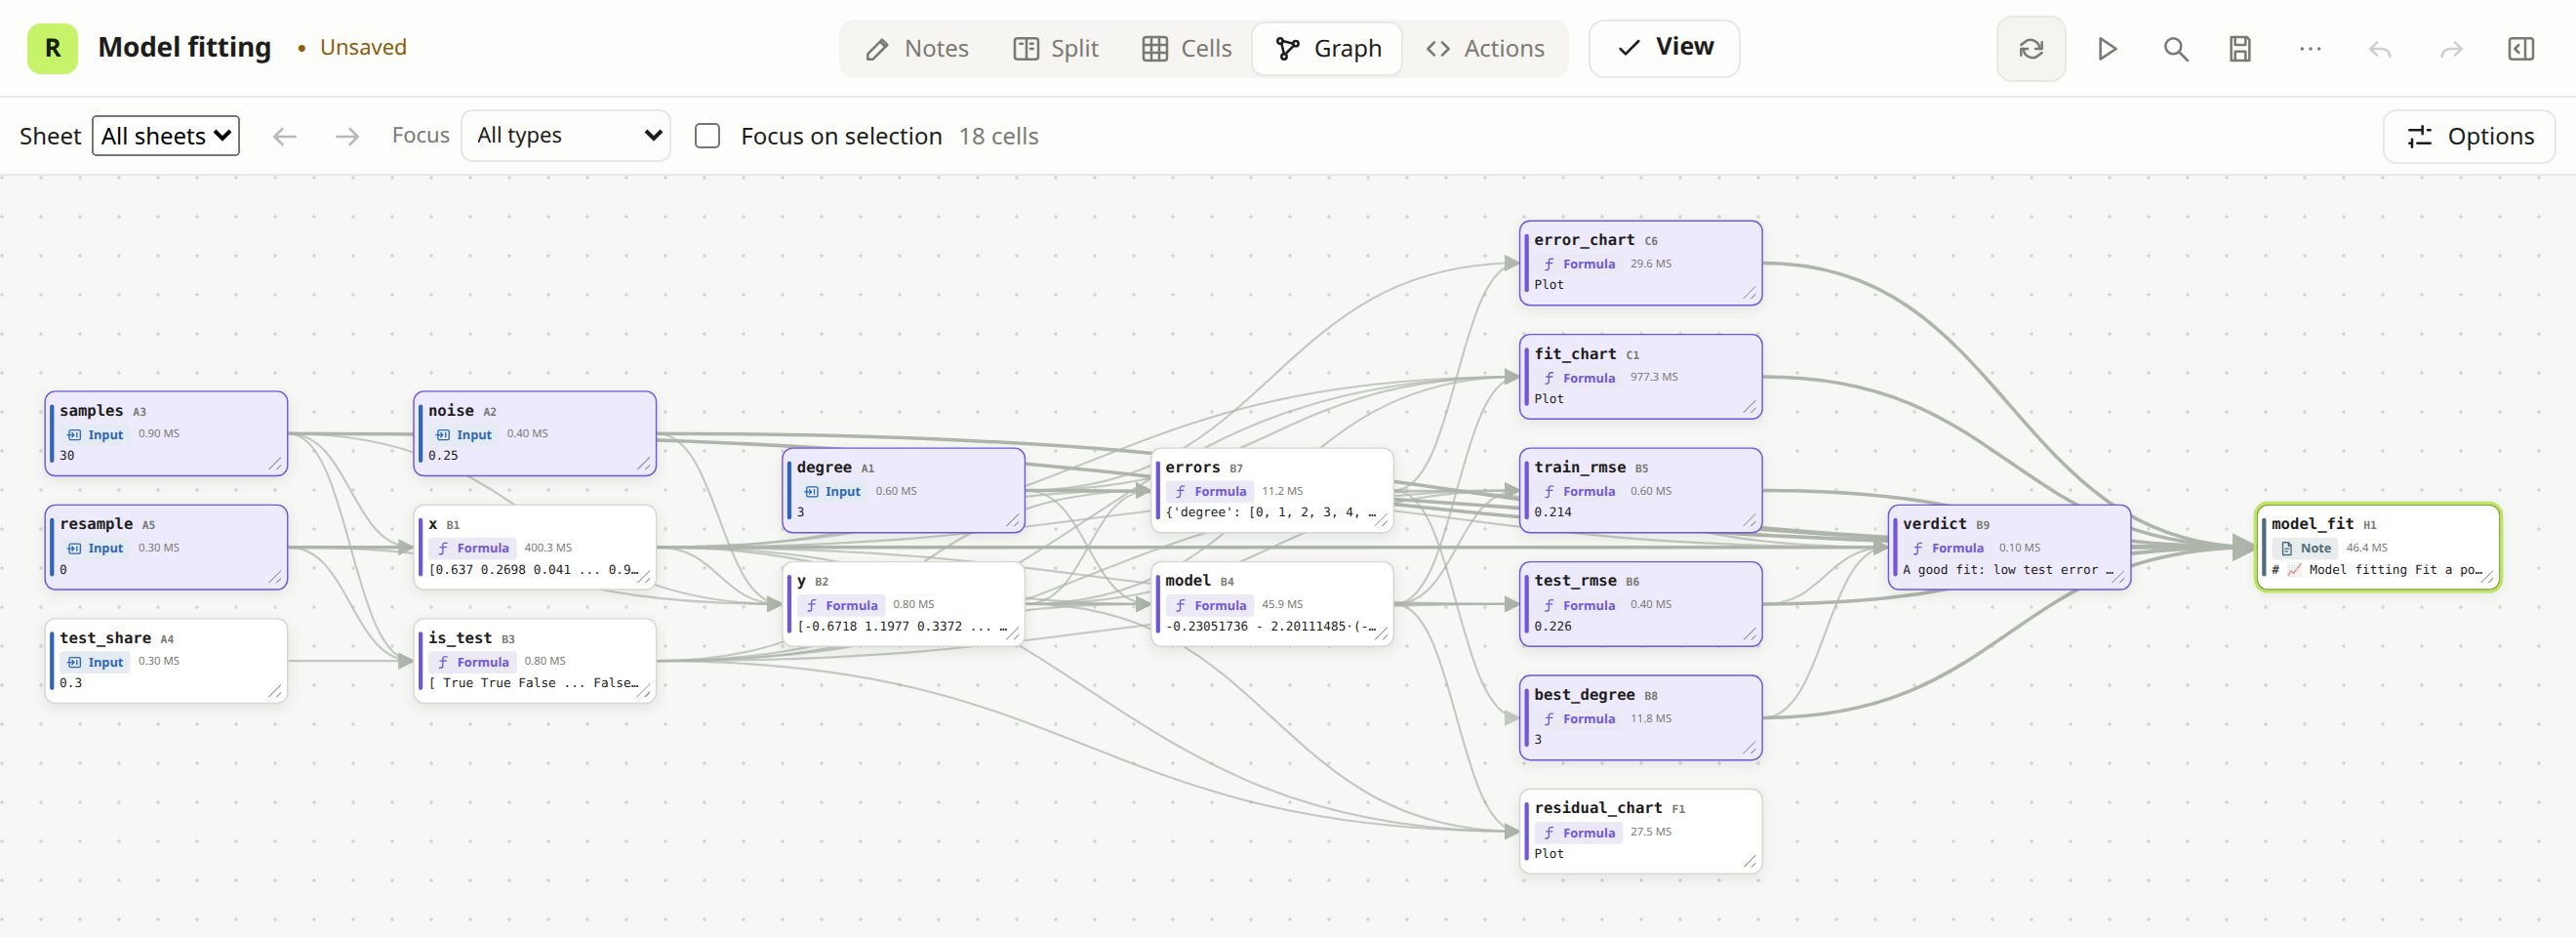
See why it changed
The dependency graph is drawn from your code. Follow a parameter to every value and plot it affects, or select a cell to see only its connections.
Notes that stay true
Markdown with live values, LaTeX, sliders and figures. The explanation reads from the cells, so it cannot drift from the numbers.
Share it as an app
reaktiv-workbook run serves the notes and controls as an
interactive app for colleagues. Nothing to rewrite.
AI in the loop
With --mcp, Claude Code, Cursor or any MCP client works in your
live workbook while you watch: new cells, another approach, a plot. Every change is one undo step.
Signals at the core
Underneath is reaktiv, a signals library for Python. Signals keep the state of modern UI frameworks consistent with very little code; here they keep a model consistent while you change it.
- Reading is subscribing. A cell depends on exactly what it reads while it runs. Nothing to declare or wire up, and a branch that is not taken is not a dependency.
- Only what is affected reruns. A change marks the cells that read it as stale; they recompute in dependency order, and a result that comes out the same stops the update there.
- Lazy and cached. A derived value is computed when something needs it and reused until one of its inputs changes.
- Side effects are explicit. Formulas only compute. Writing files, calling services and changing inputs happen in effects and actions, where you can see them.
# plain reaktiv, in any Python program
from reaktiv import computed, effect, signal

price = signal(3.5)
cups = signal(120)
revenue = computed(lambda: price() * cups())
report = effect(lambda: print(f"revenue: {revenue()}"))
# revenue: 420.0

price.set(4.0)   # revenue: 480.0
cups.set(120)    # unchanged: nothing reruns
Input
signalState you change: a parameter, a slider, a list of rows.
Formula
computedDerived from other cells in ordinary Python, from one expression to a pandas pipeline or a figure.
Linked input
linked signalA suggested value derived from other cells that you can override, and reset.
Resource
resourceA value that arrives later: a file, a query, an API call. It reloads when its parameters change and reports loading and errors.
Effect
effectRuns when what it reads changes: write a file, send an alert, log a result.
Action
methodA step you trigger from a button or an agent, such as importing data or resetting a scenario. It can change inputs.
Examples you can run now
Each opens in your browser with Python running locally through Pyodide: nothing to install, nothing uploaded. Move a slider and watch it propagate.
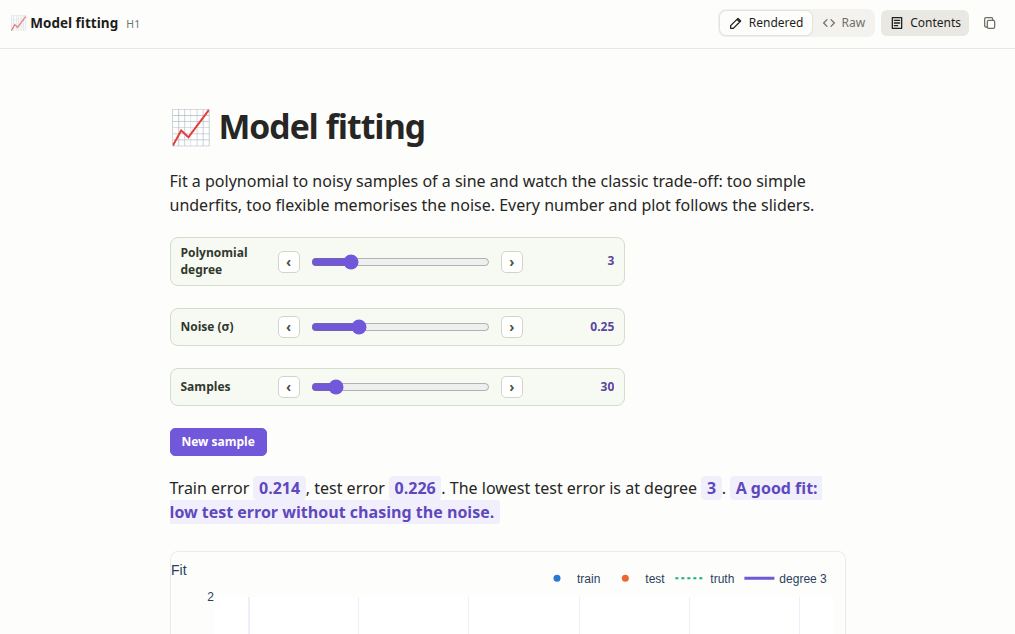
Model fitting
Change the polynomial degree, noise and sample size; watch underfitting and overfitting happen.
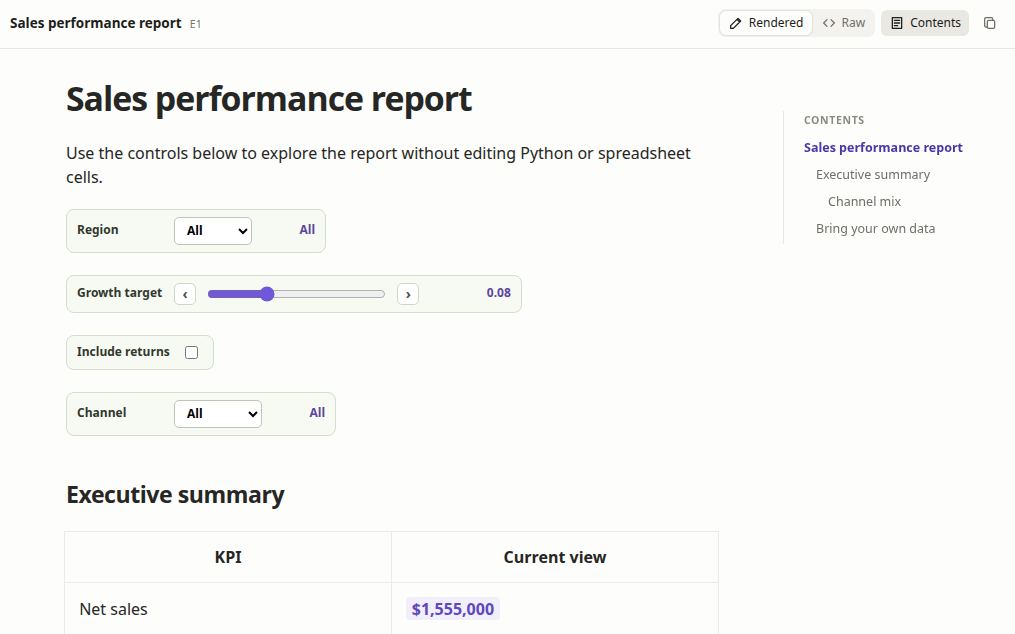
Sales report
Pick a region and channel, set a growth target; KPI tables and charts follow.
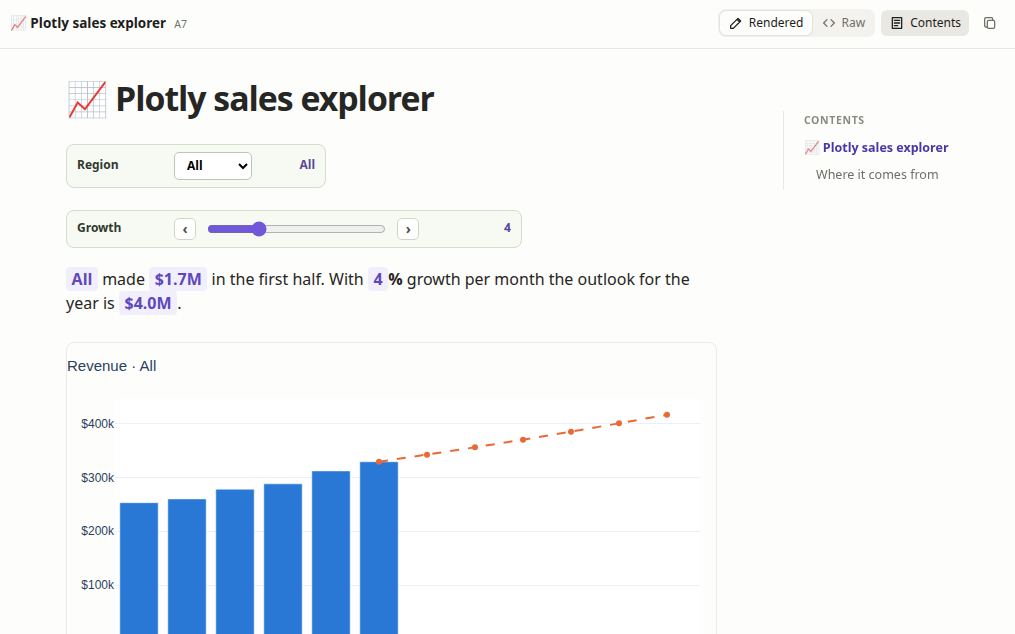
Plotly explorer
A region filter and a growth slider drive interactive Plotly figures.
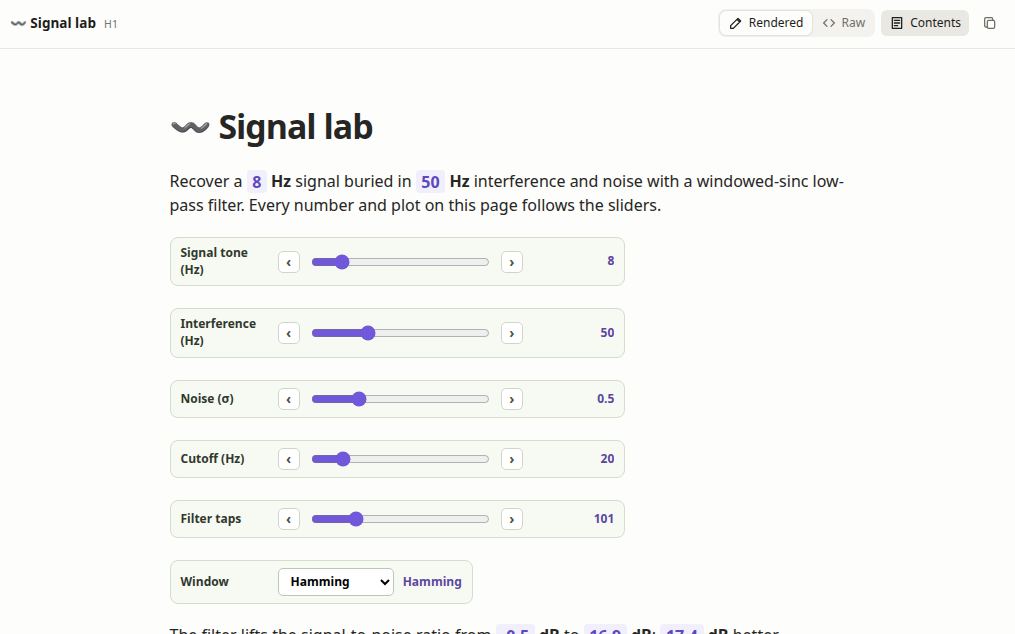
Signal lab
Recover a tone from interference and noise; time, spectrum and filter plots follow.
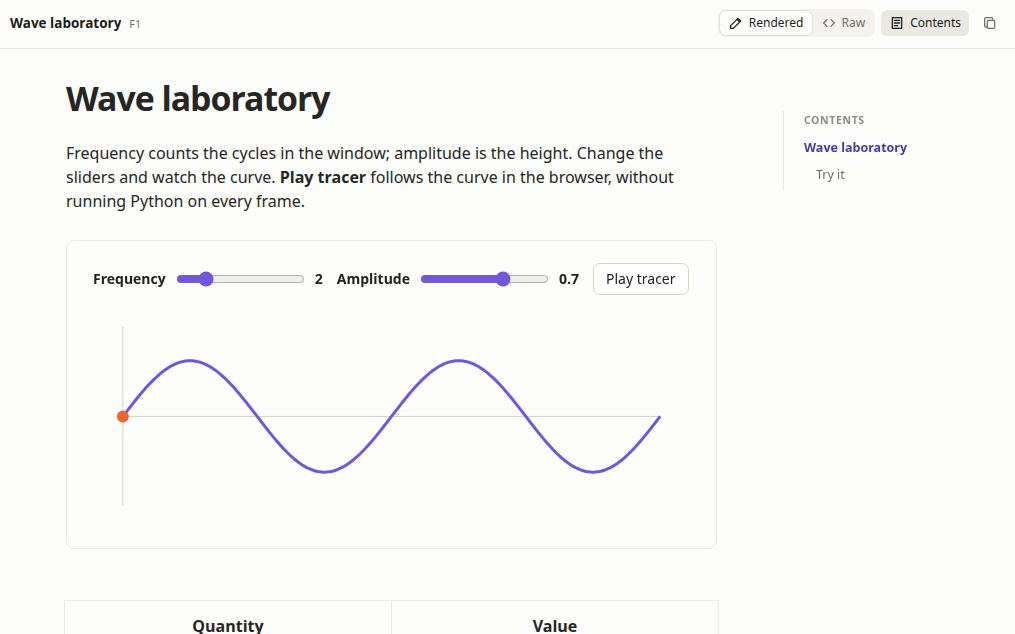
Wave laboratory
A custom anywidget with an animated tracer; cells follow it.
Live monitor
Poll a sensor on a timer, keep a trend, alert above a limit.
Questions
How is this different from a notebook?
A notebook runs cells in the order you execute them, so what you see can depend on what you ran before. Here cells are named and read from each other; the runtime keeps every result consistent with its inputs, so what you see is always what the code computes. The same file is shown as notes, as a grid of cells and as a dependency graph.
Does it use my own Python and packages?
Yes. reaktiv-workbook edit runs on your machine, in your environment. A workbook also lists
the packages it needs in its header; --sandbox installs them into an environment of its own
with uv.
Is my data uploaded anywhere?
No. In the browser, Python runs locally through Pyodide. On your machine, the editor talks only to the local Python process it was started from.
Where is my work saved?
In one .workbook.py file: plain Python you can review in a pull request, diff in Git and run
with python.
On your machine
The command line opens the same editor on your files, with your Python and your packages.
# model-fit.workbook.py (simplified excerpt)
class ModelWorksheet(Worksheet["ModelFittingWorkbook"]):
    degree = cell("A1", field(3), label="degree")

    @cell("B4", label="model")
    @computed
    def model(self):
        train = ~self.is_test()
        return np.polynomial.Polynomial.fit(
            self.x()[train], self.y()[train], self.degree())
$ pip install reaktiv-workbook
$ reaktiv-workbook new --from model-fit
$ reaktiv-workbook edit model.workbook.py
$ reaktiv-workbook run model.workbook.py   # an app
$ reaktiv-workbook check model.workbook.py # in CI
$ reaktiv-workbook edit model.workbook.py --mcp # AI